Accessible analysis
Work through a graphical interface while retaining scriptable R functions for repeatable pipelines.
BIOSZEN helps researchers turn Excel tables, CSV files, and optical-density time series into statistical results, growth parameters, concentration–response models, customizable plots, and reproducible exports—without requiring plotting code.
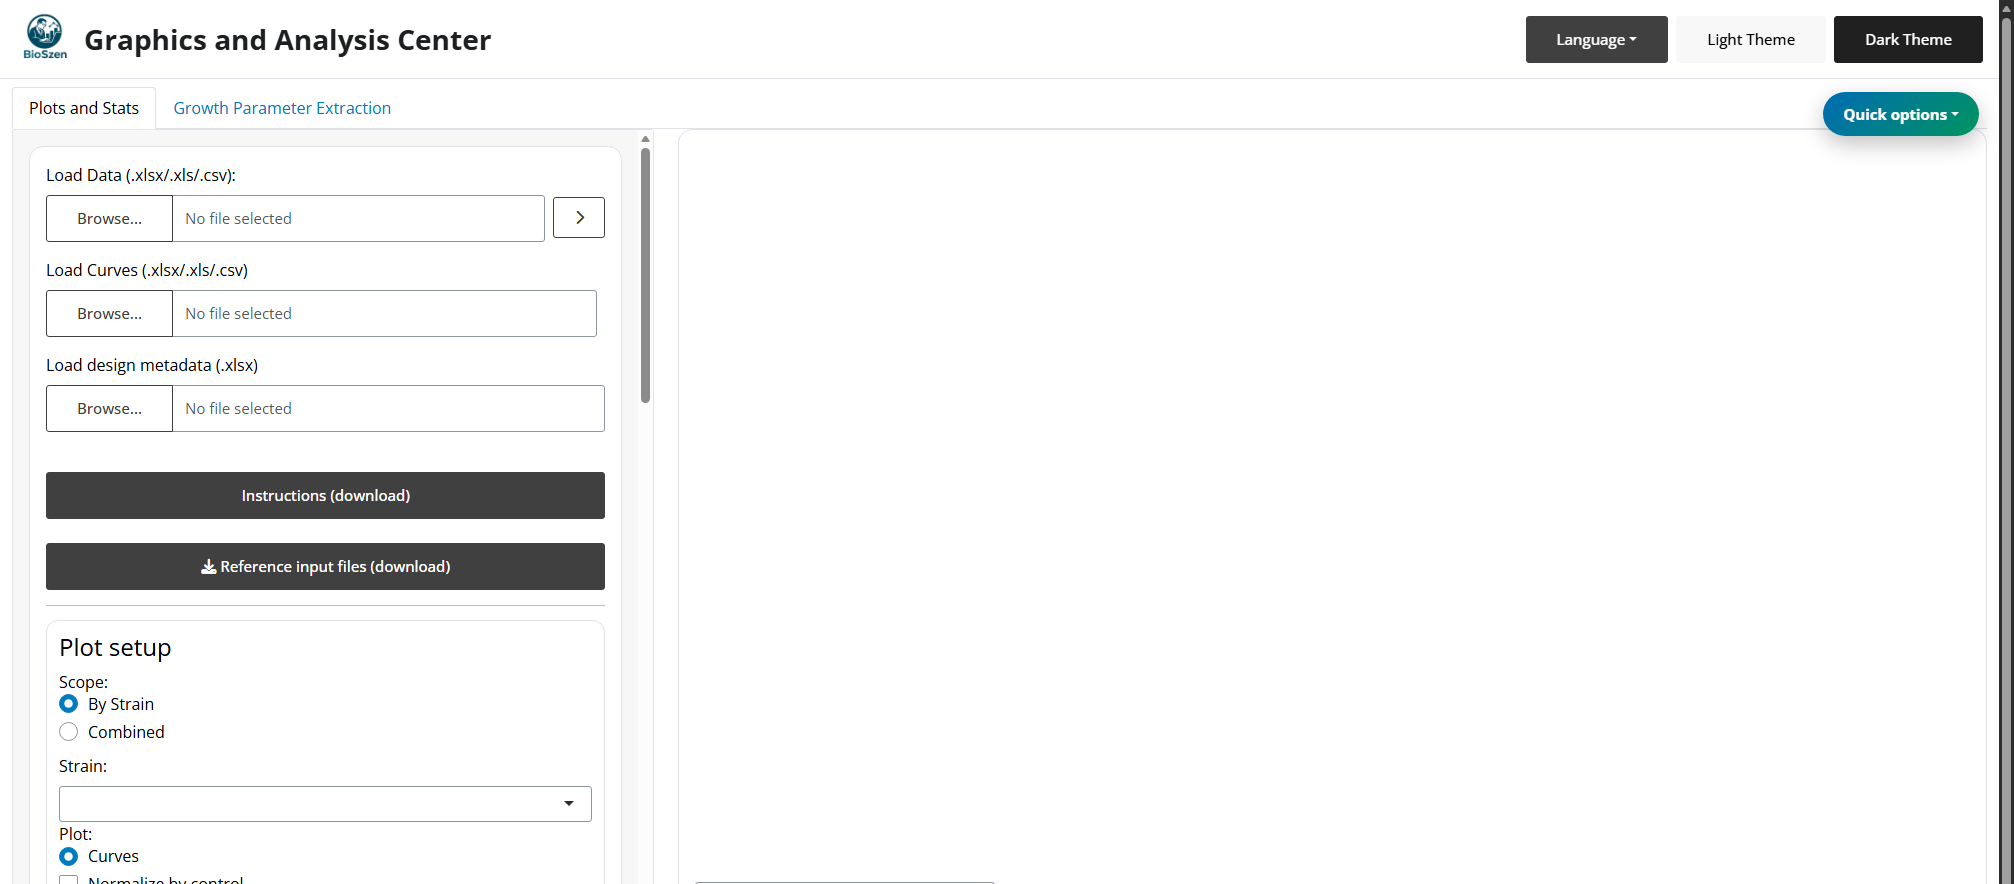
BIOSZEN brings data preparation, exploratory visualization, statistical analysis, growth-curve analysis, figure assembly, and reproducibility records into one guided local workflow.
Work through a graphical interface while retaining scriptable R functions for repeatable pipelines.
Use normalization, replicate-aware quality control, normality tests, significance tests, post hoc comparisons, and multiple-testing correction.
Create boxplots, bar plots, violin plots, curves, stacked plots, heatmaps, correlation plots, correlation matrices, and multi-strain concentration–response curves.
Export processed data, statistics, metadata, plots, composition panels, and reusable ZIP bundles.
Experimental biologists, microbiologists, students, and research teams that want guided biological data analysis with reproducible R workflows and publication-ready outputs.
BIOSZEN is distributed through R-universe. After installation, launch it from R or from the BIOSZEN RStudio Addin.
install.packages(
  "BIOSZEN",
  repos = c(
    "https://bioszen.r-universe.dev",
    "https://cloud.r-project.org"
  )
)

BIOSZEN::BIOSZEN()The complete workflow runs on the user's computer. Files loaded into the local session are processed locally.
After installation and an RStudio restart, select Addins > Launch BIOSZEN in Browser.
Use the hosted demo to explore the interface. Prefer the local installation for the complete workflow and for sensitive experimental data.
The recommended Platemap + Curves workflow combines a structured experimental workbook with optional well-based time-series measurements.
Use Platemap + Curves, grouped parameters, summary tables, or CSV input.
Import the primary experimental file and, when needed, the well-based time series.
Validate groups, parameters, replicates, and well mappings before analysis.
Configure plot families, labels, axes, fonts, colors, legends, and annotations.
Normalize against controls, run statistical tests, and inspect significance results.
Save plots, tables, metadata, PowerPoint figures, and reproducibility bundles.
The recommended primary workbook contains a Datos sheet with observations and a PlotSettings sheet with plotting metadata. A separate curves file can provide a Time column and well measurements such as A1, A2, and A3.
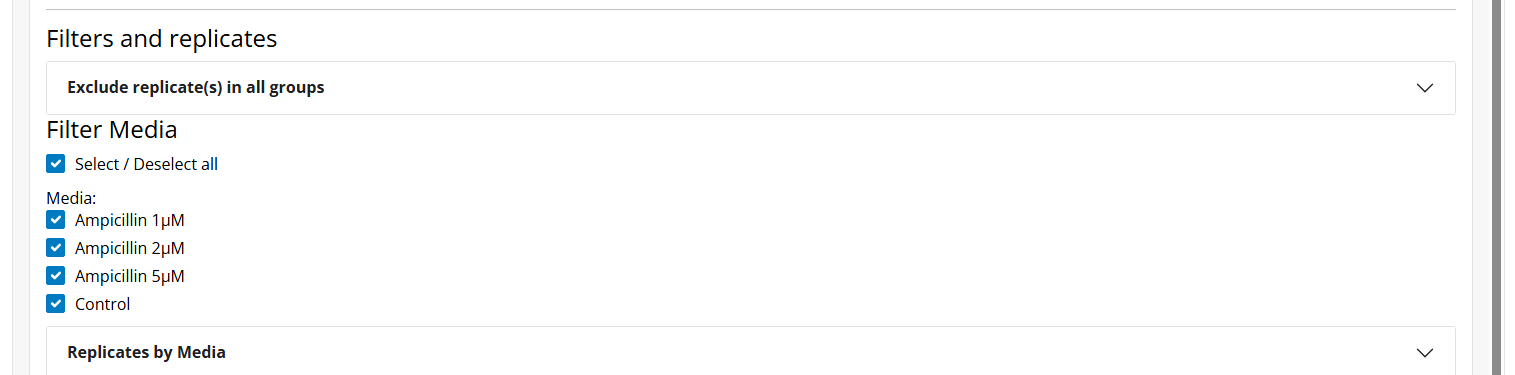
For plate-reader outputs and other parameter tables, the recommended Platemap format records biological and technical replicates and helps keep measurements organized. See the input examples, or use the Platemap and Curves skill with AI assistants such as Codex, Claude, Google Antigravity, and other compatible agents to convert data from other formats—including curve data—into BIOSZEN-ready files.
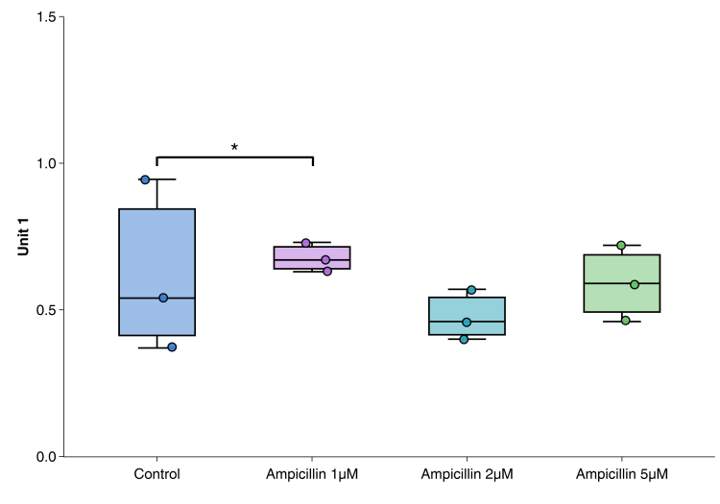
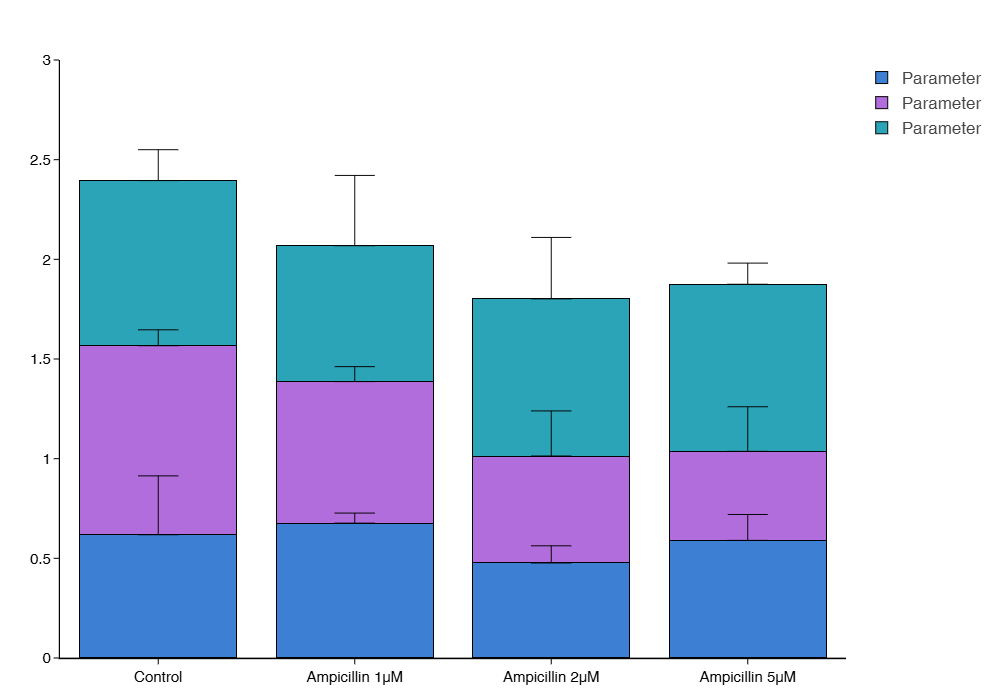
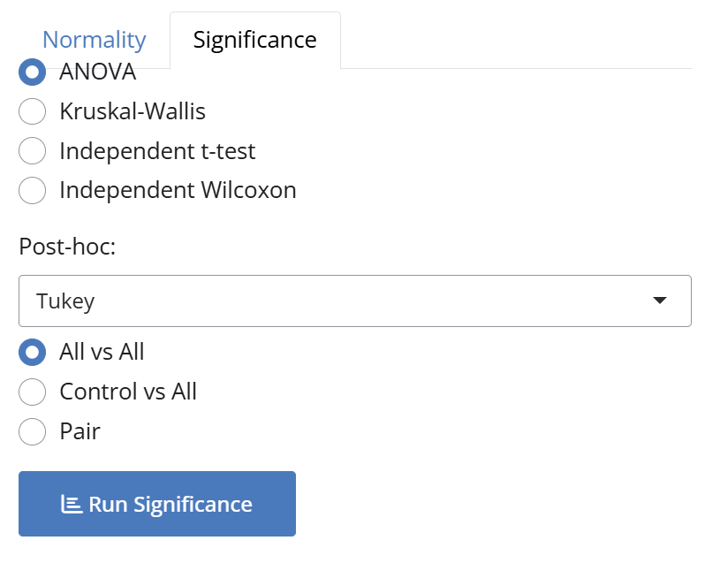
BIOSZEN supports control-based normalization with replicate-aware behavior and provides a guided route from assumption checks to significance results.
BIOSZEN 2.1.2 generates concentration–response plots for selected strains, conditions, and biological replicates using raw parameters or responses normalized to a control. Detected concentrations and units remain editable before fitting.
Fit an independent four-parameter log-logistic inhibitory curve for every selected strain and compare them in one figure.
Estimate IC50 values, curve parameters, model diagnostics, susceptibility ranks, and pairwise strain comparisons.
Use the selected raw growth parameter or its control-normalized response while preserving group and replicate filters.
Show individual biological replicates, mean with SD or SEM, or fitted curves without points, with optional 95% confidence bands.
The growth module plots trajectories and calculates parameters independently for each well or curve. Fixed interval remains the default. The optional irregular/discontinuous mode reads the actual increasing numeric values from a detected or user-selected time column, supporting uneven observations such as 0, 0.08, 0.17, 0.5, 1, and 2. Both modes use the same robust-first detector and permissive fallback.
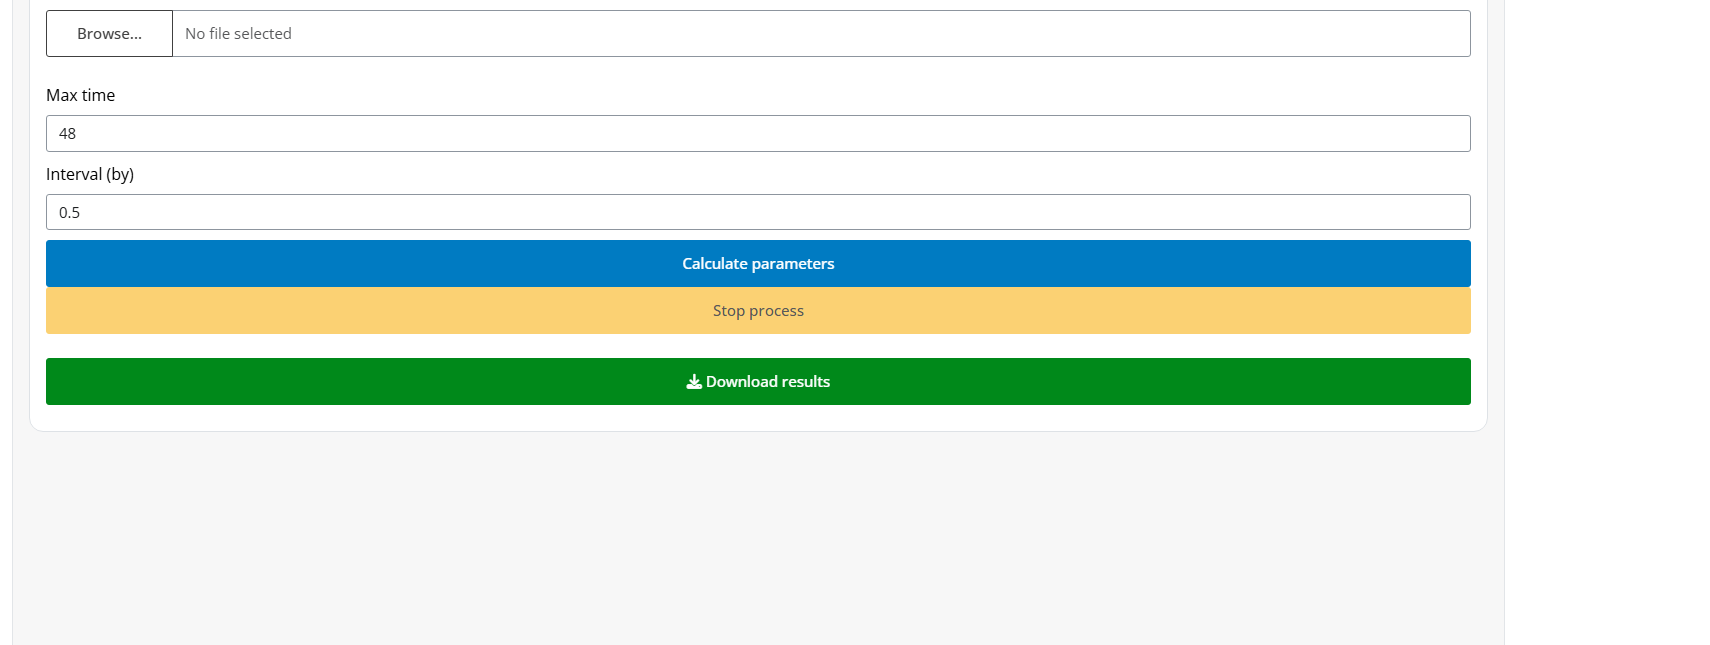
growth_results <- BIOSZEN::growth_parameters(
  "Curvas.xlsx",
  max_time = 48,
  time_interval = 0.5,
  output_dir = "growth_results",
  overwrite = FALSE
)

irregular_results <- BIOSZEN::growth_parameters_irregular(
  "irregular_curve.xlsx",
  time_column = "Time"
)| Parameter | What it represents | How to interpret it |
|---|---|---|
µMax | Maximum specific growth rate estimated during the detected exponential-growth interval. | Higher values indicate faster exponential growth; units are inverse time. |
max_percap_time | Mean time of the interval used to estimate µMax. | Locates the strongest exponential-growth interval on the time axis. |
doub_time | Estimated doubling time, calculated as log(2) / µMax. | Lower values indicate faster growth. |
lag_time | Estimated start of the detected exponential phase. | Larger values indicate a longer delay before rapid growth. |
ODmax | Highest observed optical-density value. | Maximum recorded density during the experiment. |
max_time | First time at which ODmax is observed. | Indicates when the maximum recorded density is reached. |
AUC | Area under the complete OD-versus-time curve. | Summarizes accumulated growth across the experiment. |
OD0 | First valid measurement after observations are ordered by time. | Describes starting density or baseline OD. |
Units: time-related parameters inherit the unit used in the input Time column.
Export individual plots, multi-plot composition panels, processed workbooks, statistical tables, metadata, and reusable analysis bundles.
# Launch the app
BIOSZEN::BIOSZEN()

# Extract growth parameters
results <- BIOSZEN::growth_parameters("Curvas.xlsx")

# Check or install an approved update
BIOSZEN::bioszen_update_available()
BIOSZEN::bioszen_update()

# Display the official citation
BIOSZEN::bioszen_citation()Choose the route that fits your goal: inspect scientific registries, install the package, read the manual, explore the demo, inspect the source, or cite the archived release.
Install BIOSZEN and inspect its package build and documentation.
InstallRead the English user manual or inspect the complete source code.
Explore a limited hosted version of the interface before installing locally.
Try onlineDiscover BIOSZEN in the community-driven life-science software registry.
bio.toolsInspect BIOSZEN metadata and research-software monitoring information in the OpenEBench Software Observatory.
OpenEBenchUse BIOSZEN's persistent Research Resource Identifier when reporting the software in publications and Methods sections.
RRID:SCR_028902Access the complete BIOSZEN archive, DOI, and version history.
ZenodoBIOSZEN is open-source software distributed under the GPL-3.0 license.
LicenseSzenfeld, B. (2026). BIOSZEN [Computer software]. Zenodo. https://doi.org/10.5281/zenodo.18217210
Research Resource Identifier: RRID:SCR_028902